adds legend to the swplot figure
Syntax
swplot.legend
swplot.legend(switch, hFigure)
status = swplot.legend
Description
swplot.legend adds legend to the active swplot figure.
swplot.legend(switch, hFigure) adds/removes/refreshes the legend on the
swplot figure referenced by the hFigure handle depending on the
switch string.
Examples
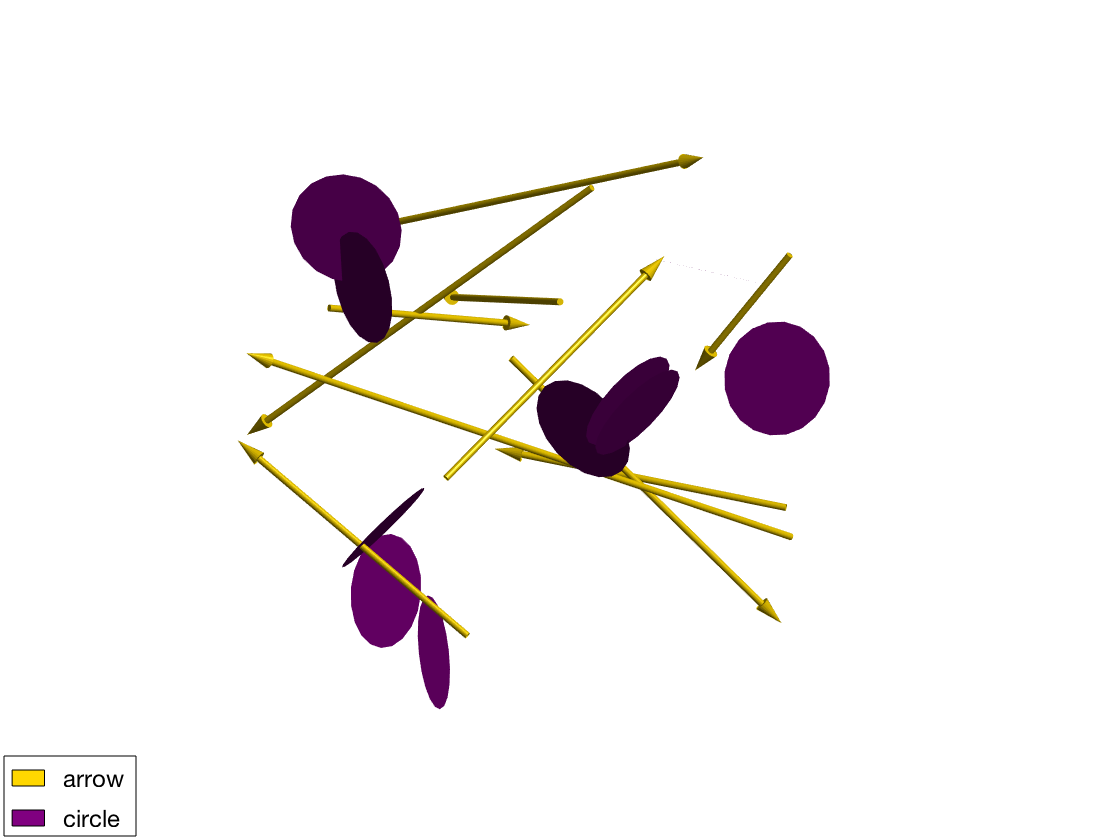
This example shows how the default legend for arrow and circle objects looks like.
swplot.plot('type','arrow','position',rand(3,10,2)*10-5,'legend',1,'color','gold')
swplot.plot('type','circle','position',rand(3,10,2)*10-5,'R',1,'legend',1,'color','purple')
swplot.zoom
swplot.legend

Input Arguments
switch- One of the following string:
'on'show legend,'off'hide legend,'refresh'redraw legend,'-'|'--'|'none'change the linestyle of the legend frame.
Default value is
'on'. hFigure- Handle of the swplot figure, default value is the handle of the active figure.