
Tutorial 36#
Anisotropic exchange on the FM chain#
Define the lattice#
fmch = spinw;
fmch.genlattice('lat_const',[3 4 4])
fmch.addatom('r',[  0 0 0],'S',1)

fmch.addmatrix('label','J_1','value',diag(-[3 4 5]))

fmch.gencoupling
fmch.addcoupling('mat','J_1','bond',1)

fmch.genmagstr('mode','helical','S',[0 0 1]')
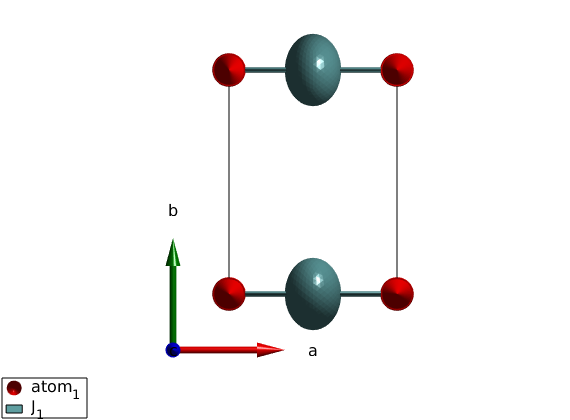
plot(fmch)
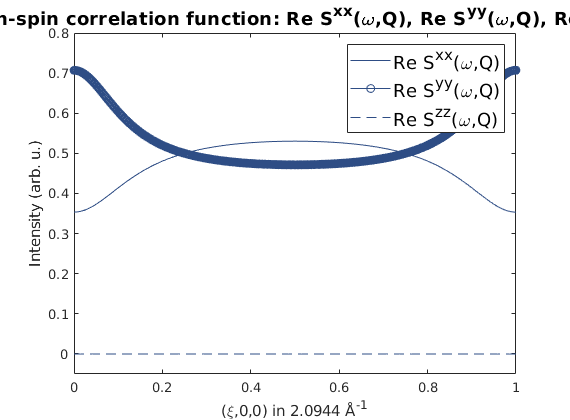
spin-spin correlation function#
spec = fmch.spinwave({[0 0 0] [1 0 0] 501});
spec = sw_egrid(spec,'component',{'Sxx' 'Syy' 'Szz'});

clf
sw_plotspec(spec,'mode','int','dE',0.5);
ylim([-0.05 0.8])
anisotropic exchange on the AFM chain#
afmch = spinw;
afmch.genlattice('lat_const',[3 4 4])
afmch.addatom('r',[  0 0 0],'S',1)

afmch.addmatrix('label','J_1','value',diag([3 4 4.1]))

afmch.gencoupling
afmch.addcoupling('mat','J_1','bond',1)

afmch.genmagstr('mode','helical','S',[0 0 1]','k',[1/2 0 0],'n',[1 0 0])
%plot(afmch)
spin-spin correlation function#
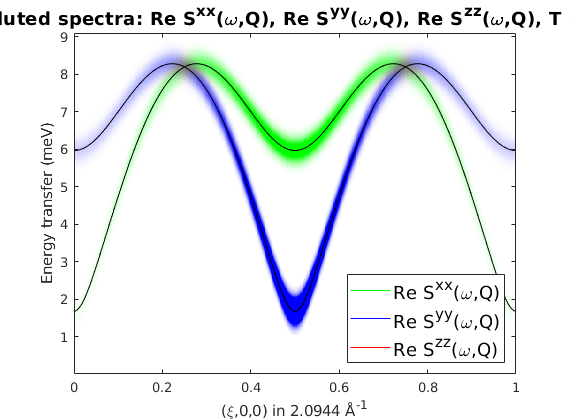
spec = afmch.spinwave({[0 0 0] [1 0 0] 501});
spec = sw_egrid(spec,'component',{'Sxx' 'Syy' 'Szz'});

clf
sw_plotspec(spec,'mode','disp','linestyle','-','colormap',[0 0 0])
colorbar off
legend off
sw_plotspec(spec,'mode','color','dE',0.5,'axLim',[0 1]);
hold on
hLegend = legend;
set(hLegend,'location','southeast')
Warning: The two times the magnetic ordering wavevector 2*km = G, reciproc
lattice vector, use magnetic supercell to calculate spectrum!
anisotropic exchange on the AFM chain#
rotated anisotropy
afmch = spinw;
afmch.genlattice('lat_const',[3 4 4])
afmch.addatom('r',[  0 0 0],'S',1)

R = sw_rotmatd([0 0 1],45);
J1 = diag([3 4 4.1]);
J1 = R*J1*R';

afmch.addmatrix('label','J_1','value',J1)

afmch.gencoupling
afmch.addcoupling('mat','J_1','bond',1)

afmch.genmagstr('mode','helical','S',[0 0 1]','k',[1/2 0 0],'n',[1 0 0],'nEXt',[2 1 1])
%plot(afmch)
spin-spin correlation function#
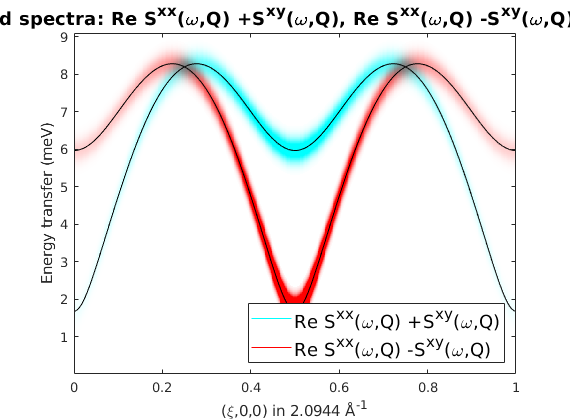
spec = afmch.spinwave({[0 0 0] [1 0 0] 501});
spec = sw_neutron(spec,'uv',{[1 1 0] [-1 1 0]},'pol',true);
spec = sw_egrid(spec,'component',{'Sxx+Sxy' 'Sxx-Sxy'});

clf
sw_plotspec(spec,'mode','disp','linestyle','-','colormap',[0 0 0])
colorbar off
legend off
sw_plotspec(spec,'mode','color','dE',0.5,'axLim',[0 1]);
hold on
hLegend = legend;
set(hLegend,'location','southeast')
Published with MATLAB® R2018b